Monitoring helps you understand the performance of your system, it shows you anomalies and informs you about your system's status.
In this article we will setup grafana, prometheus and node_exporter with docker for system monitoring.
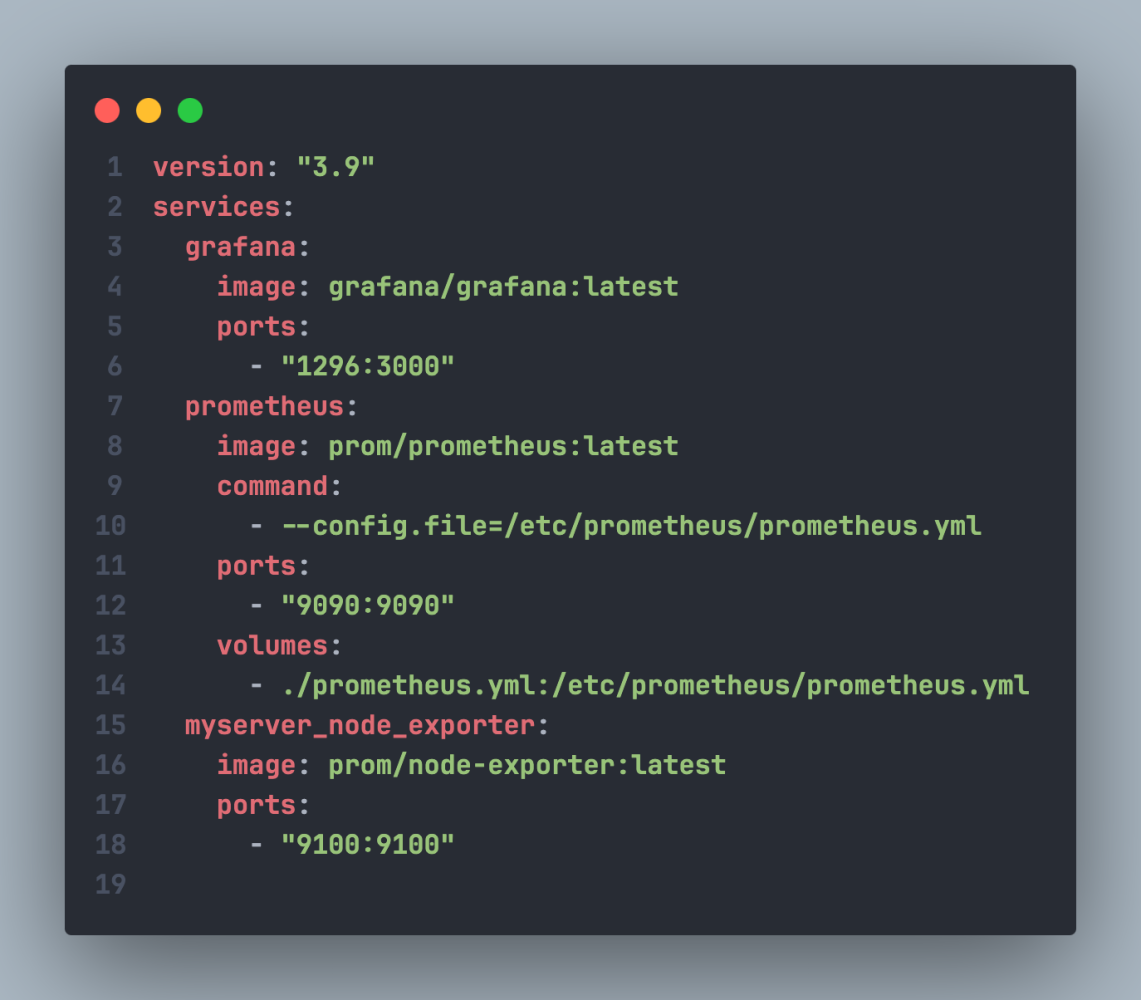
Docker compose configuration for Grafana & Prometheus:
Here's the docker compose configuration (you can find all config files from below as raw code):
Explanation of settings:
Grafana:
- image: grafana/grafana:latest: We use the latest image of grafana.
- restart:always: Set restart policy as always.
- ports: 1296:3000: Expose port 3000 as 1296 (3000 is grafana's default port)
Prometheus:
- image: prom/prometheus:latest: We use the latest image of prometheus.
- command: - --config.file=/etc/prometheus/prometheus.yml: Set prometheus config as /etc/prometheus/prometheus.yml
- ports: - "9090:9090": Expose port 9090 (9090 is prometheus's default port)
- volumes: - ./prometheus.yml:/etc/prometheus/prometheus.yml: Map our custom prometheus config file.
Node_Exporter:
- image: prom/node-exporter:latest: We use the latest image of node_exporter.
- ports: - "9100:9100": Expose port 9100 (9100 is node_exporter's default port)
Prometheus configuration:
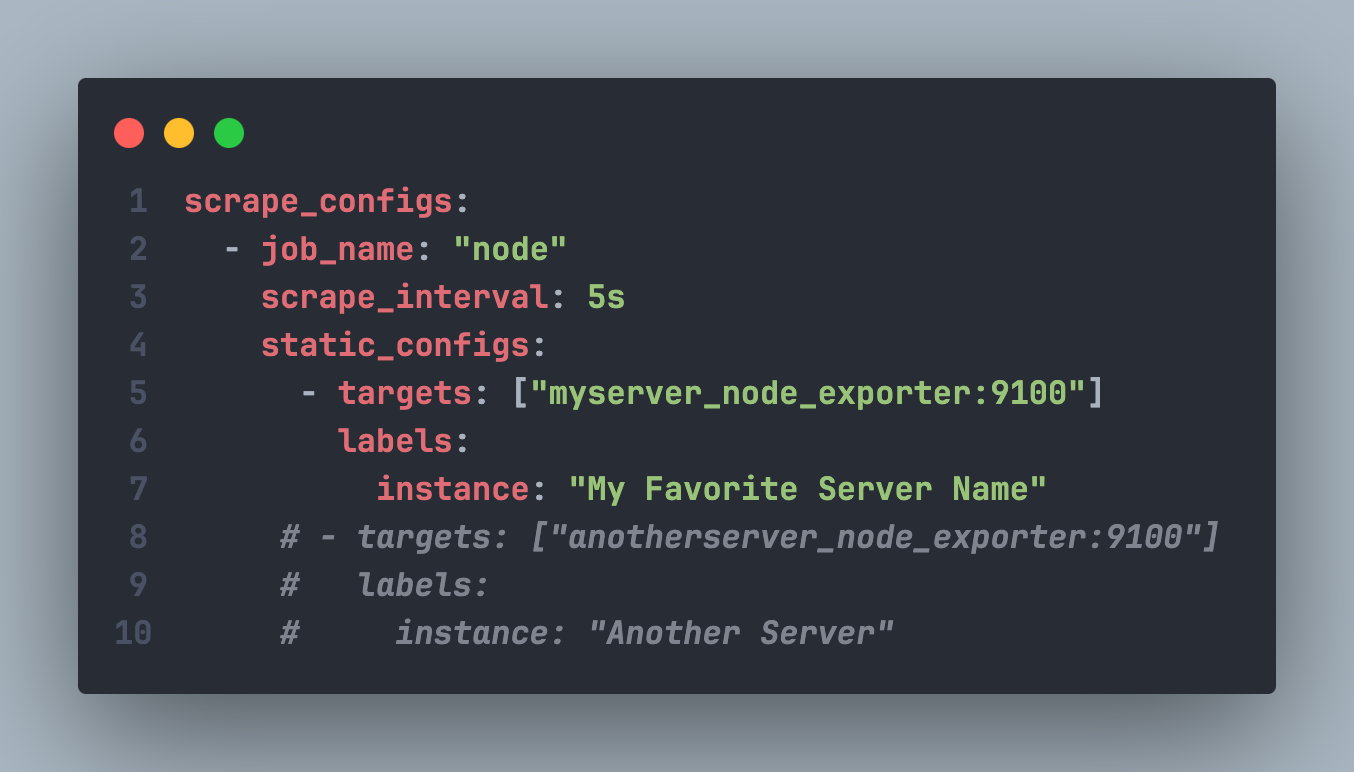
Explanation of settings:
- scrape_interval: 5s: Time of when prometheus scrape your system metrics, 5s is enough for real time metrics.
- static_configs: Specify which targets gonna scraped, it can be dynamic with discovery services in real world scenarios.
Project structure:
.
├── docker-compose.yml
└── prometheus.yml
Lets try run the stack:
docker stack deploy -c docker-compose.yml monitoring-stack
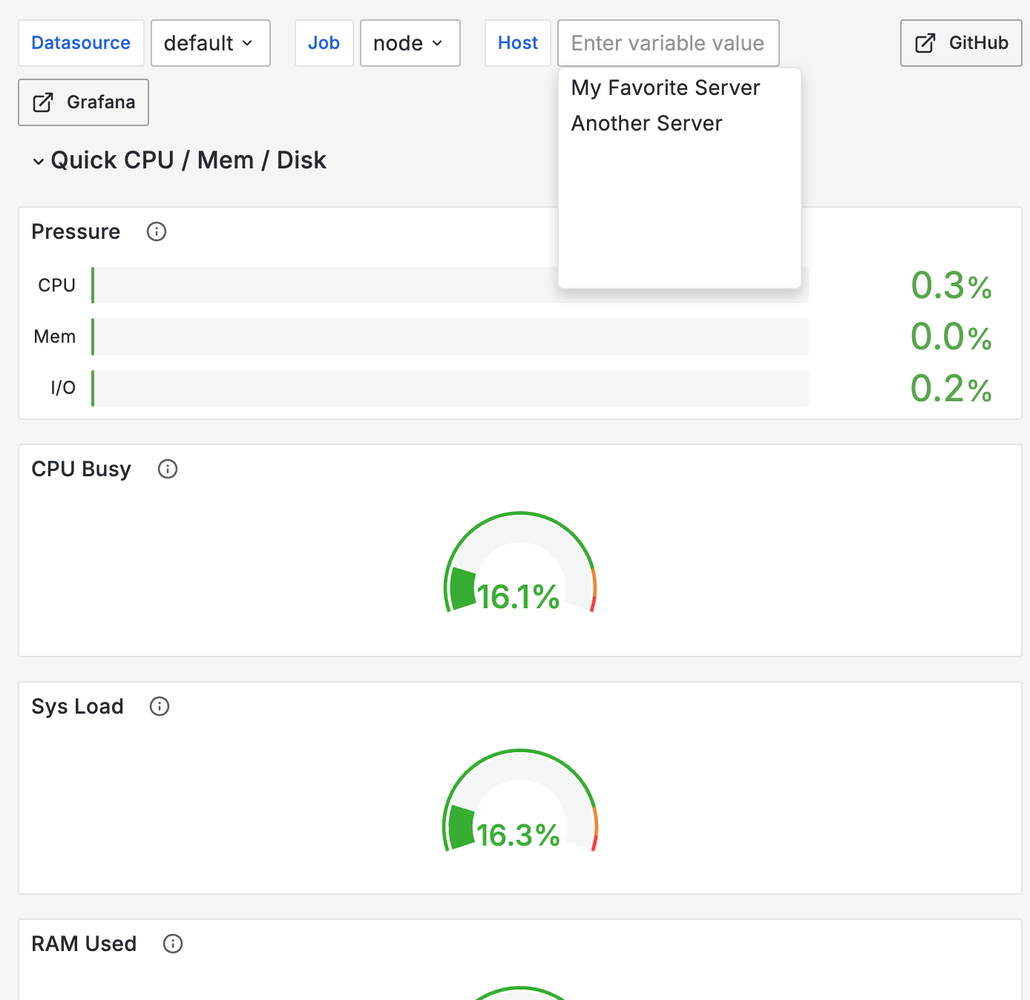
You can access the grafana dashboard via http://localhost:1296
After that steps if you configure everything correctly it should be working! For visualization you import premade configs from grafana labs:
https://grafana.com/grafana/dashboards/405-node-exporter-server-metrics/
Conclusion
We’ve set up a fully functioning monitoring stack with prometheus, grafana and node_exporter with using docker.
For complete configurations you can visit: https://github.com/halitsever/grafana-docker-compose